Analysis of results and added value 🔧
Download of additional data
Additional earth observation data can be downloaded using the 🔗 EODAG tool.
Models comparison
This 🔗 Jupyter notebook allows for the comparison of flood forecast model outputs and remotely sensed observations of flooded areas.
Calculation of the impact on the road network
The outputs of the DassFlow-2D model, generated in the previous step, are vectorized and then ingested into a spatial database. A layer crossing is performed dynamically in order to calculate the impact of the episode on human activities.
To highlight the impact on road traffic, it is possible to display the data in the GIS application QGIS directly accessible in the 🔗 remote desktop. This QGIS project should be opened:
$HOME/projects/metis-demo-hydro/code/qgis/dassflow2d/dassflow2d.qgs
The QGIS plugin upload_to_geostorm
 allows to transfer these information layers and their display configuration to the
Geostorm
geospatial platform.
The latter is used to facilitate the
dissemination of results.
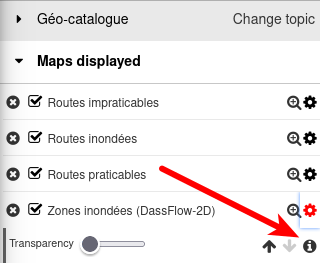
The legend of the Flooded Areas layer (DassFlow-2D) is available in the layer manager:
allows to transfer these information layers and their display configuration to the
Geostorm
geospatial platform.
The latter is used to facilitate the
dissemination of results.
The legend of the Flooded Areas layer (DassFlow-2D) is available in the layer manager:

Cela permet de calculer l'impact de la crue sur la viabilité routière et la population et d'ainsi fournir de précieuses informations aux services de secours.
Five layers are loaded into Geostorm here:
- The vectorization of the model output,
- The intersection of this layer with the road network from OpenStreetMap (x3),
- The INSEE cells containing inhabitants over 65 years old.
This makes it possible to calculate the impact of the flood on the road viability and the population and thus provide valuable information to the emergency services.
Presentation of the final dashboard
The 🔗 final dashboard provides decision makers with a synthetic interface to access the results of the impact calculation. The web interface of this tool allows for complete, online configuration of data access and how the dashboard is displayed.
The end 🏁
🗑️ Reset
- Suppressing the output of DassFlow2D:
- Reset of the repo: